In our November edition of Edubytes, our guest editor is Lecturer, and Teaching and Learning Fellow Francis Jones, from the UBC Department of Earth, Ocean and Atmospheric Sciences. He shares the Department’s project to implement open source computational tools and teaching tactics to facilitate hands-on interdisciplinary learning in data-driven scientific exploration.
At UBC, Earth, Ocean and Atmospheric Sciences (EOAS) represent excellent learning contexts for students to develop applied quantitative, computational and data skills. To quote a 2019 report to the Faculty of Science,
“…current and future graduates need skills to organize, interact with, and extract meaning from data. [These skills] … are applicable to a wide and expanding range of career paths and will open future opportunities for UBC students, as well as contribute to a data-literate citizenry.”
The recent three-year TLEF-funded Opensource Computing for Earth Science Education (OCESE) project was one of many initiatives responding to that report. Its goal was to incorporate open source computational tools and teaching tactics to facilitate hands-on interdisciplinary learning in data-driven scientific exploration. Using open source, cloud-based computing, quantitative and computational skills have been integrated more comprehensively across the EOAS curriculum, incorporating real world examples and datasets into existing core and service courses. Other similar initiatives are being implemented across UBC’s two campuses and in other comparable institutions, and the community of educators contributing open source tools, techniques and wisdom continues to grow rapidly.
Why are we using open source?
Open source educational developments are benefiting courses ranging from remote sensing to economics, quantitative geography, and medicine. Instructors can leverage and contribute to the growing global community of developers and educators. Development is rapid, community support is collegial, and maintaining resources can be “hands on” rather than dependent upon third parties. At the same time, students are gaining both current and long-term benefits of developing self-propelled learning habits using widely-used, standard, and collaborative resources and practices. It also minimizes costs of software and resources, and helps ensure education is transparent, understandable and universally available – i.e. it is consistent with the University’s aspirations regarding open education. It also helps reduce the “isolation” of educational development. We have learned to avoid “reinventing the wheel” by leveraging the active and welcoming open source communities.
By 2019, the Department of EOAS had largely agreed on using Python as the computing language of choice in all relevant EOAS courses, mainly because it continues to grow in importance across data science disciplines, including the entire breadth of geoscience (see for example Project Pythia). At the same time, Jupyter Notebooks have become the preferred environment for learning because it is free, web-hosted, and highly versatile. Instructors can provide computational and data-rich facilities that students use without writing code. For instance, students could be asked to adjust parameters or short segments of code, or they could produce fully-fledge software applications themselves.
Students’ experiences
In all educational initiatives, obtaining meaningful student feedback is important for determining successes and identifying priorities for improvement. All students in a third year time-series course either agreed or strongly agreed that
“I am happy that Python is the language we are using,” and that: “Jupyter Notebooks are effective for helping me develop the skills we are learning” (see more feedback).
Also, students in the first offering of the Python version of DSCI 100, Introduction to Data Science, gave largely positive course evaluations. The instructor said:
“Especially when speaking with some of the more senior students, I got the impression that Python connected well with other courses and what they can see using in their futures.”
Understanding and managing our planet’s natural world is increasingly quantitative, so non-specialists must gain some facility with use of numbers, manipulating and making sense of data and models, and relating physical processes to the real world. Leveraging the success of interactive apps introduced in 2016 for an applied geophysics course, the OCESE project developed new facilities that enable exploration of specific datasets or concepts. Seventeen dashboard apps used in 16 courses were built, including learning activities and pedagogic support to help instructors incorporate them into their courses.
In one example, students interactively explore the extent to which linear models can — or cannot — predict future CO2 concentrations based on over 60 years of measurements in Hawaii and Antarctica. Similar activities are widely used in climate courses; what’s novel here is that open source data and practices were adapted to make a tool with a simple, focused purpose, piloted with students and improved based on feedback. The resulting code and learning activities are available in the open domain for others to use or improve.
Students are reacting well to opportunities to interact with and extract meaning from data. Feedback comments included:
“I like how interactive the data is, and how we can see how things change when we choose different trends,” and “I like that these activities allow me to visualize concepts covered in class.”
Regarding a different app used in an oceanography course:
“I like how integrated it is and how it connects all the topics dealt with in this course so far,” and: “It was interesting and challenging to use real-world data – I saw firsthand the difficulties that one can have in defining the two layers of a two-layer model.”
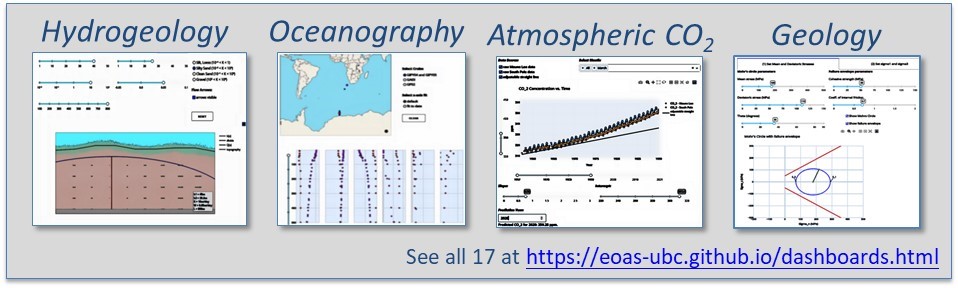
Concepts illuminated by these dashboard apps include groundwater behaviour, global properties of ocean water, geological and geophysical concepts, and more. The user’s view of four different apps is shown below, and details can be explored starting at the dashboards page of our extensive OCESE documentation.
Accessibility and inclusion benefits deriving from data science and open resources are also anticipated, although with some caveats. The UBC panel discussion (PDF) offers some perspectives on creating inclusion and accessibility through data science.
Instructors’ experiences
Professional development was a major goal for instructors in open resource design, deployment and pedagogy. Unfortunately, the COVID-19 pandemic overlapped with the project’s timeframe. Also, since development can take two-to-three teaching terms, “training” ended up mainly as one-on-one interactions between developers, instructors, student employees, and – crucially – graduate teaching assistants, whose energy and dedication were invaluable. Paired teaching was also important for training in five out of twenty courses.
Instructors who introduced dashboard apps enjoyed the creative process and access to on-demand educational and technical support. One reaction was:
“I love how sliders constrain/adjust axes, data at real stations are chosen on a map and compared, and graphic results can be saved to submit for assessment.”
Transforming whole courses to Python was more challenging. Senior courses were relatively straight forward since materials and activities could be translated without changing the course’s objectives or content. For example, converting ten MatLab assignments in a third year time-series analysis course took roughly 120 hours for a skilled undergraduate student employee. Also, a skills-check exercise was developed to help students identify gaps in prerequisite knowledge, including pointers to resources that help them catch up where needed.
Transforming first or second year courses was much more complex and “expensive.” For DSCI 100, three professors and four students devoted significant time translating the open source text, lesson materials, assignments and assessments. As a result of this collegial effort, course evaluations from the pilot offering were mainly positive. Additionally, that section’s waitlist was fully booked, suggesting that students were keen to learn Python.
Transforming EOSC 211, Computer Methods in Earth, Ocean and Atmospheric Sciences, from MatLab to Python was similarly expensive, with additional challenges finding effective Jupyter hub solutions before UBC’s system became available. Also, addressing automatic assessment issues, critical for larger courses, was not easy. Tools for automatically generating assessments and grading them are improving, but there are learning curves. UBC instructors currently use WeBWork, PrairieLearn, Crowdmark, and other platforms, and Canvas Speedgrader can be used with Jupyter Notebooks (see guidelines by Assistant Professor of Teaching Dr. Tiffany Timbers). A Jupyter plugin for assigning and grading Jupyter notebooks, nbgrader was adopted for DSCI 100. The open source community is actively working on improvements, but it currently requires skills and a Jupyter hub managed by instructors. Nbgrader was also tried in EOSC 211, but was found to be unwieldy, so a custom solution was built by a senior teaching assistant instead.
An important aspect of professional development and sustainment of project outcomes is the extensive documentation written as a Jupyter Book with Creative Commons licensing. Topics include descriptions and results of piloted initiatives, guidelines for technical aspects of developing and using open source resources, and tutorials for students and instructors.
Concluding remarks
Educational use of both Jupyter Notebooks and interactive dashboard apps is gaining momentum. Instructors are benefitting from the versatility and creative opportunities of open source resources and practices. When students interactively engage with data, computing and quantitative concepts, they become more motivated and can practice applying those concepts to analysis, decision-making, troubleshooting and problem-solving.
Currently, access to Jupyter Hub facilities is available to anyone at UBC with a standard Internet browser and a CWL. This system is rapidly gaining traction. According to the CTLT’s Senior Manager, Learning Applications Integrations & Analytics Stephen Michaud and his team, since 2022, the rough count of unique users has grown from 1000 to 2500, and it now regularly handles around 700 concurrent users. Twenty-six courses have hubs started at specified times, while other, smaller courses, have students use hubs on an as-needed basis. High stakes assessments are also being piloted on the system, with three midterm and two final exams being run in fall 2023. These are still early days, perhaps analogous to the introduction of learning management systems. But with commitment and creativity—and the support of institutional funding, personnel, and educational expertise—students and instructors can have ubiquitous access to engaging and effective learning opportunities based on open source resources and practices.
Enjoyed reading about implementing computational tools for learning? Learn about other topics we covered in the November 2023 edition by reading the complete Edubytes newsletter. To view past issues, visit the Edubytes archive.
Are you interested in staying up to date on the latest trends in teaching and learning in higher education? Sign up for our newsletter and get this content delivered to your inbox once a month.
